NZ's Building Rebound: Residential Activity Up 4.4%, Consents Up 21% — What It Means for Property Investors
Residential building activity rose 4.4% in the June 2026 quarter, and 41,268 new homes were consented in the year to August, up 21%. House values are still falling.
October 2026 · Building, not prices
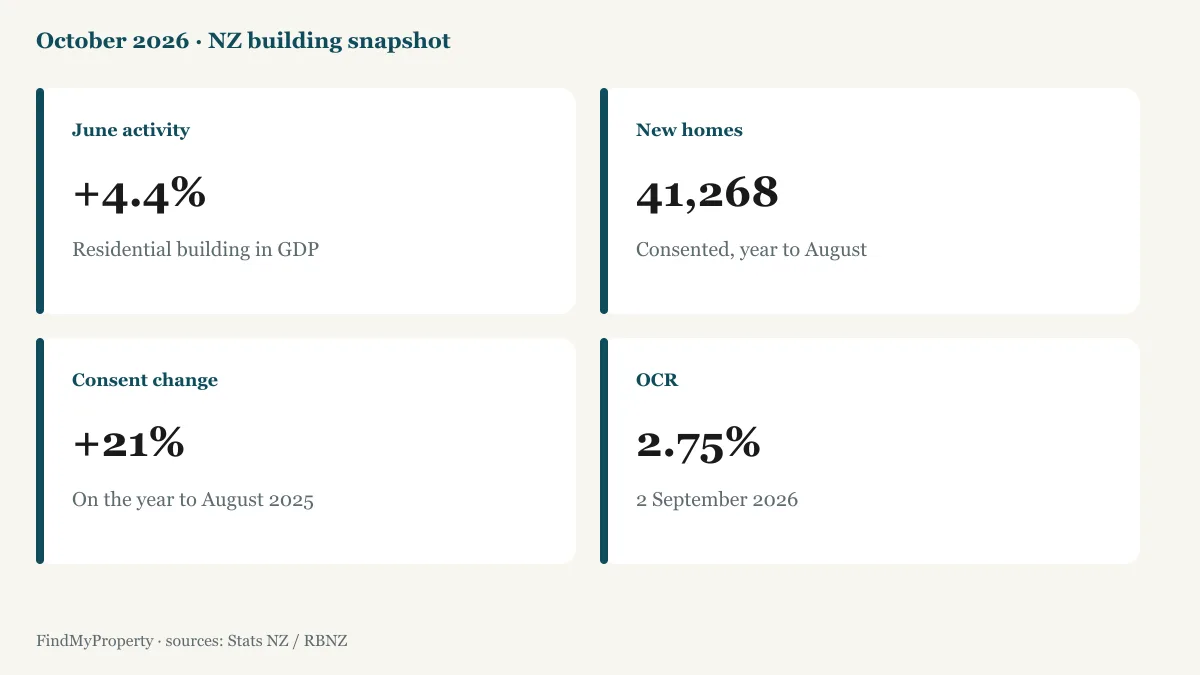
Residential building activity rose 4.4% in the June quarter, the best result BNZ has seen since 2021, and Stats NZ counted 41,268 new homes consented in the year to August, up 21%. National house values have still fallen for six months. A construction recovery is not a price recovery.
After nearly five years of decline, New Zealand’s residential construction sector has turned. Construction was the largest upward contributor to June-quarter GDP. New-home consents are being led by Canterbury, Otago and Auckland. For anyone who sells timber, pours concrete, or staffs a site, that is the best news in years.
For a property investor it is only useful if you know what sits underneath it. Consents are an intention to build. Activity is work already under way. Neither one is a house price. In 2026 those series are pulling apart: more homes are being approved, while buyers still hold the negotiating power on the homes already for sale.
This is for value-add and yield investors deciding whether to buy, renovate, or develop. It is not a forecast, and it is not a brief to chase new townhouses because the consent charts look lively. Screen existing residential stock on Browse properties, then do your own due diligence.
Key takeaways
- Activity is recovering. Residential building in the GDP accounts rose 4.4% in the June quarter. The separate building-work volume series rose 4.8%.
- Consents are up 21% year on year, at 41,268 new homes in the year to August. That is still about a fifth below the 50,653 consented in the year to August 2022.
- Growth is lopsided. Auckland and Canterbury account for more than 70% of the national increase. Otago is the third leg. The West Coast went backwards.
- The mix has shifted toward townhouses. Townhouses, flats and units are 18,085 of the annual total, about 44%. Apartments fell 4.0%.
- It is a recovery without a property boom. Cotality’s national median fell for a sixth month, to $797,078. The OCR is 2.75%, and construction costs are rising again.
- Treat consents as a ceiling, not a guarantee. BNZ says fewer consents may be turning into builds than the old 90%+ conversion rate.
The numbers at a glance
| Measure | Latest result | Source |
|---|---|---|
| Residential building in GDP, June 2026 quarter | +4.4% (gross fixed capital formation) | Stats NZ, 17 September 2026 |
| Construction industry, June quarter | +2.7%, largest upward GDP contributor | Stats NZ GDP |
| Residential building volume | +4.8% on the March quarter, seasonally adjusted | Stats NZ building work put in place |
| Total building work put in place | $8.2 billion, +5.2% on a year earlier | Stats NZ, June quarter |
| New homes consented, year to August 2026 | 41,268, up 21% | Stats NZ |
| Stand-alone houses | 19,096, up 21% | Stats NZ |
| Townhouses, flats and units | 18,085, up 25% | Stats NZ |
| Apartments | 2,381, down 4.0% | Stats NZ |
| New homes consented per 1,000 residents | 7.7, up from 6.4 a year earlier | Stats NZ, year to August |
4.4% and 4.8% are both real
You will see two residential growth rates for the June quarter. Both come from Stats NZ, and they are not a contradiction.
- The 4.4% is from the GDP release on 17 September. Residential building work rose 4.4% inside gross fixed capital formation. BNZ uses this figure in Construction Crossroads and calls it the best quarterly residential result since 2021.
- The 4.8% is from Value of building work put in place. Seasonally adjusted residential volume rose 4.8% on the March quarter. Total building volume rose 4.8% as well. In dollar terms, not adjusted for cost or season, total work was $8.2 billion, up 5.2% on the June 2025 quarter. Residential work in that value series was up 11% to $5.2 billion.
Building-work figures stay provisional for the latest three quarters and were revised in the June release. The March quarter was first published as a 2.2% residential fall. It now shows a 0.1% dip. The early-2026 slump was shallower than the first release, so the June rebound is a bit less dramatic than a comparison with that first March number suggests. Direction is the same either way.
Why the rebound looks so strong
BNZ describes a near five-year downtrend in which residential construction volumes contracted by about a quarter. Start from a hole that deep and a 4.4% quarterly lift, or a 21% annual consent increase, looks large partly because the comparison is weak.
- Consents are well off their peak. Interest.co.nz, citing Stats NZ, notes 41,268 is still well below the 50,653 homes consented in the year to August 2022. This is a return toward 2023 levels, not boom conditions. NZ Adviser, also citing the release, calls the August year the highest annual total since 2023.
- The annual rate is back above 40,000. The year to July was already 40,908. August took it to 41,268.
- The month-to-month path is choppier than the annual headline. Stats NZ’s August release shows seasonally adjusted consents up 5.6% in August after a 4.5% fall in July. The July release had also recorded a 3.7% fall in June. Three soft months and one bounce is not a market accelerating away.
- The wider industry is still climbing out. BusinessNZ’s September 2026 Planning Forecast, as reported by B2B News, estimates total construction activity fell from about $63.0 billion in 2023 to about $55.7 billion in 2025, with a return toward those earlier levels not expected until around 2030.
The direction has changed. The climb is slow. BNZ’s own verdict on whether the June quarter is the start of a trend is a “weak thumbs up”: a tepid uptrend, with its forecasts weaker than the Reserve Bank’s.
Where the growth is: Canterbury, Otago and Auckland
National percentages hide different regional stories. Stats NZ’s year to August 2026 is the clean comparison. Auckland and Canterbury together account for more than 70% of the national increase in consents.
Canterbury: the standout
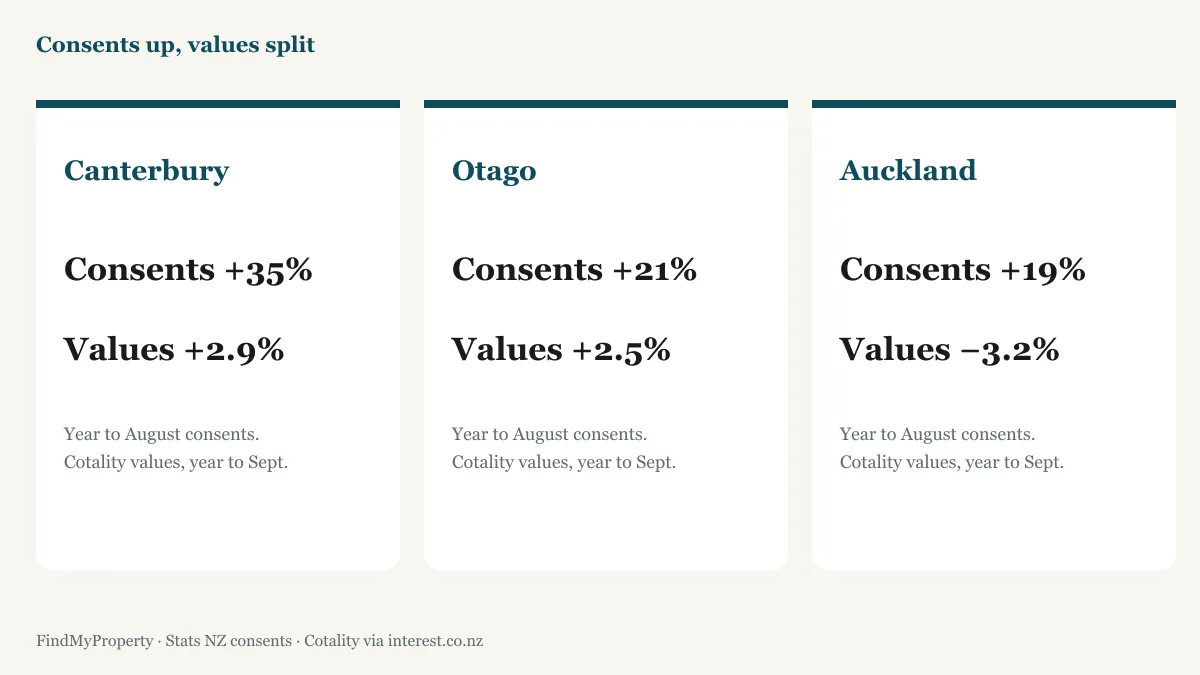
Canterbury consented 8,933 homes in the year to August, up 35%, the strongest growth of any large region. Multi-unit homes drove that increase, up 44%. In the July year, Stats NZ put Christchurch city at 4,773 (up 28%) and Selwyn district at 2,355 (up 59%). Those district counts are a month behind the regional August total, so do not add them into 8,933.
On a per-person basis the July year is just as sharp: 12.5 homes consented per 1,000 Canterbury residents, the highest of the major regions in that release. For the year to August, Selwyn’s rate was 27.6 per 1,000 residents. BNZ says Canterbury consents per capita have reached highs not seen since the 2014 post-earthquake rebuild, with an important caveat: because so many of today’s consents are smaller townhouses, consented floor area per capita is still an estimated 25% below that 2014 peak.
Activity, not just paperwork, is up too. Stats NZ’s regional building-work series (actual dollars, not adjusted for cost inflation) put Canterbury at $1.4 billion in the June quarter, up 14% on a year earlier. BNZ’s own regional estimates also put Canterbury in front for the quarter.
Otago: Queenstown-Lakes does the heavy lifting
Otago consented 2,987 homes in the year to August, up 21%. In the July year its rate was 11.6 homes per 1,000 residents, second among the regions in that table. At district level, Queenstown-Lakes had the highest consent rate in the country in the year to August, at 38.7 homes per 1,000 residents, with Selwyn next. BNZ’s “central Otago” line is about this part of the South Island, not a claim that every Otago district looks the same. Queenstown-Lakes and Central Otago are different districts.
Auckland: the volume leader
Auckland consented 17,264 homes, up 19%. That is the biggest count of any region. Stand-alone houses drove Auckland’s increase, up 39%, even while townhouses remain the city’s main product. BNZ puts Auckland’s townhouse share of consents at 53%, the highest in the country.
Building work in the June quarter was $3.2 billion in Auckland, up 3.7% on a year earlier, on Stats NZ’s nominal regional series. Consents are growing faster than the value of work put in place. That gap is a reason not to treat a 19% consent lift as 19% more houses on the ground this quarter.
The regions being left behind
Wellington’s consents are up 18% on a rolling year (2,356 homes) and Waikato’s are up 14% (3,219). The activity series tells a harder Wellington story: June-quarter building work was $591 million, down 8.9% on a year earlier. Waikato was $692 million, up 12%. Those are nominal dollars. BNZ still notes that parts of the central and lower North Island have yet to see much of a consent uplift. Manawatū-Whanganui barely moved, from 1,035 homes to 1,054. The West Coast was the only region where the annual consent count fell, from 184 to 161.
What’s being built: the rise of the townhouse
The type of home matters as much as the count. Stats NZ’s year to August, compared with the year before:
| Dwelling type (year to August) | 2025 | 2026 |
|---|---|---|
| Stand-alone houses | 15,755 | 19,096 |
| Townhouses, flats and units | 14,503 | 18,085 |
| Apartments | 2,479 | 2,381 |
| Retirement village units | 1,341 | 1,706 |
Townhouses, flats and units were about half of the annual increase. Apartments went the other way, down 4.0%. Retirement village units rose 27%, the fastest of the four groups, after two weaker years.
- A consent is not a constant amount of work. A townhouse and a four-bedroom stand-alone home each count as one dwelling. They do not need the same concrete, timber, labour, or fit-out. A recovery led by smaller homes is lighter per unit than past cycles. BNZ’s Canterbury floor-area caveat is the same point in one region.
- It changes who you are competing with. In Auckland and Christchurch, a large share of new supply is compact, medium-density product, not a like-for-like family home. Our new-build fallacy note is the investor version of that: new is not the same thing as good value.
Why now
- A very low base. Consents and activity fell for years, so almost any improvement shows up as a large percentage.
- Policy is looser on the supply side, slowly. The Going for Housing Growth programme includes an Incentives for Growth Fund of up to $400 million over four years, from 2026/27 to 2029/30, paid to councils on homes they consent. Granny flats of up to 70 square metres can, in most cases, be built without a building consent. BNZ’s caution is the useful one: demand, not the rulebook, looks like the tighter constraint this cycle.
- Intentions are firm. BNZ cites ANZ’s September survey: a net 56% of construction respondents expect higher output over the next 12 months, and residential construction intentions are elevated. That intentions series has led consents before. Some of the optimism may be civil work rather than houses.
- The wider economy. Construction rose 2.7% in the June quarter, its largest increase since the June 2023 quarter, and was the largest upward contributor to GDP. Residential construction usually moves with incomes, confidence, and the cycle. BNZ expects a cyclical lift over the next few years, still a modest one.
- Infrastructure is a separate pipeline. BNZ cites an Infrastructure Commission estimate of $71 billion of projects under way and a further $96 billion of fully funded work in the pipeline. That supports civil contractors more than it supports a house-price boom.
The catch: building is recovering, prices are not
This is the part that matters if you are buying. The September outlook already set out a tough spring for values and the cash rate. The consent surge has not cancelled it.
House values are still falling
Interest.co.nz’s report of Cotality’s September Home Value Index (1 October 2026) put the national median dwelling value at $797,078, down for a sixth month in a row and 1.33% lower than a year earlier. Cotality’s Kelvin Davidson said buyers still hold most of the negotiating power, with plentiful choice and little urgency.
| Region | Annual change in median value (September 2026) |
|---|---|
| Southland | +3.8% |
| Canterbury | +2.9% |
| Otago | +2.5% |
| Auckland | −3.2% |
| Wellington region | −3.1% |
| Hawke’s Bay | −3.6% |
Auckland is the clean illustration. Consents up 19%. Median value down 3.2%. Canterbury and Otago are the regions where consents and values are at least pointing the same way, and even there the value gains are a few percent, not a boom.
The cash rate is rising
The Reserve Bank lifted the OCR to 2.75% on 2 September, the second 25-basis-point increase after July’s hike, the first in more than three years. Annual inflation was 4.1% in the June quarter, with petrol the largest contributor. BNZ’s forecast from here is a further quarter-point at each meeting, peaking at 3.75% by March 2027. That is one bank’s path, not a fact. The next OCR decision is on 28 October. Financing costs for developers and for investors coming up to a refix are heading up from here until the Bank says otherwise.
Costs are climbing again
Residential construction prices, on the capital goods price index inside the building-work release, rose 1.4% in the June quarter, up from 0.5% in March. BNZ says cost inflation has started to lift after about three years of sideways movement, with upside risk from fuel, petrochemicals, and a weaker New Zealand dollar, because a lot of materials are imported. Flat house prices against rising build costs means BNZ’s rough “incentive to build” ratio is biased to fall a little further.
Population growth is subdued
BNZ expects annual population growth to stay below 1% through 2027. At that pace, home building is likely to stay ahead of what is needed to house new households. That is a long way from the under-building of 2013 to 2020. Extra supply, without a matching lift in people, is a cap on rents and prices, not a reason they must rise.
Not every consent becomes a house
Historically, Stats NZ data has pointed to more than 90% of consents turning into building work. BNZ says industry contacts now report that rate may have eased, with some developments paused or scaled back. The bank still thinks there is enough in the pipeline to support higher activity for the next six to nine months. Use the consent total as a ceiling on near-term work, not a floor.
A busier order book is also not the same thing as a profitable one. Fixed-price work priced in a quieter market can lose money once materials and subcontractors reprice. The investor version of that risk is a renovation quote that was fine last year and is not fine now.
Screen existing stock, not the headline
When build costs rise and values do not, the listings that still stack up are usually existing homes, not a new-build premium. Browse properties scores residential value-add and rental listings. Create a free account if you want a watchlist while you check a district’s consent pipeline.
What this means if you are buying
The points below are our read of the figures, not a forecast. The street matters more than the national release.
- Do not treat a construction recovery as a price recovery. Values are still drifting lower in the biggest markets, buyers can take their time, and the cash rate is a headwind. Supply is being added where the numbers allow it — mostly Canterbury, Otago, and Auckland — not because prices are about to take off.
- Check the local pipeline before you buy. Selwyn and Queenstown-Lakes are not Whanganui. Stats NZ publishes consents by region and by district, including dwelling type. A rental competing with a wave of new townhouses is a different deal from one competing with a handful of older stand-alone houses.
- The build-cost squeeze favours existing stock. When it costs more to build and sale prices are flat, new stock has to clear a higher hurdle. That is the case for buying below replacement cost and adding value with a renovation, which is why we keep coming back to sub-$750k value-add and to which renovations still pay.
- Budget more for trades and cost creep in the busy regions. Canterbury, Queenstown-Lakes, and Auckland are where consent growth is concentrated. A cosmetic refresh and a full renovation both need a fatter contingency than a year ago. Stress the flip margin against a higher quote, not last year’s.
- Model the finance. The OCR is 2.75% and BNZ’s path goes higher. If the deal only works at a lower rate at the next refix, it does not stack up. Holding costs and flip margins both move with that.
- Think in regions and in dwelling types. The South Island is ahead on both consents and values. Auckland and Wellington are weaker on price. Townhouses, stand-alone houses, and apartments are not one market. Apartment consents fell. Townhouse consents did not.
- If you subdivide or build, the policy direction helps over time. Feasibility is still dominated by what the finished home will sell or rent for, and that market is soft. Easier consenting does not repair a deal the end buyer will not pay for.
What to watch next
- 28 October: the next Reserve Bank OCR decision.
- Monthly building consents. Put the seasonally adjusted month next to the 21% annual rate. If the monthly falls return, the annual rate will fade.
- Stats NZ’s next building-work release, for the September quarter. That is the test of whether June was a turn or a one-off. Remember the latest quarters get revised.
- Whether paused consents actually start. Conversion, not the annual headline, is the near-term activity number.
- Construction costs. Fuel and the currency are the obvious paths into materials and subcontractors.
- How councils use the Incentives for Growth Fund as payments roll out from 2026/27. A consent incentive is not the same thing as a buyer.
Bottom line
Residential building has found a floor: a 4.4% quarterly lift in activity, 41,268 consents, and a clear lead from Canterbury, Otago, and Auckland. BNZ’s “weak thumbs up” is the right scale. Soft values, a rising OCR, and rising build costs are all still in the way. The useful work is regional, by dwelling type, and on the cost-versus-price squeeze — then only the properties whose numbers still work.
Run the numbers on the next listing
Browse properties scores residential listings for flip margin and yield, with a renovation estimate off the photos. Create a free account for a watchlist. Compare View pricing when you want the full breakdown. A question on a specific deal? Contact us. Scores are a screen, not financial, tax, or legal advice.
Sources
- Stats NZ — Building consents issued: August 2026 (41,268, +21%; August seasonally adjusted +5.6% after July −4.5%; 7.7 per 1,000 residents)
- Stats NZ — Annual number of new home consents continues to increase (1 October 2026; dwelling types; Auckland, Canterbury, Otago; Queenstown-Lakes 38.7 and Selwyn 27.6 per 1,000)
- Stats NZ — Annual number of home consents up 21 percent (year to July; Christchurch city 4,773, Selwyn 2,355)
- Stats NZ — Building consents issued: July 2026 (40,908 in the July year; June −3.7%; Canterbury 12.5 and Otago 11.6 per 1,000)
- Stats NZ — Value of building work put in place: June 2026 quarter (residential volume +4.8%; $8.2 billion; regional values; March revised to −0.1%)
- Stats NZ — Value of building work put in place: March 2026 quarter (residential volume first published at −2.2%)
- Stats NZ — GDP increases 0.2 percent in the June 2026 quarter (construction +2.7%; residential building +4.4%)
- Stats NZ — Annual inflation at 4.1 percent in June 2026
- BNZ — Construction Crossroads (1 October 2026)
- B2B News — Plan for a construction crawl, not the boom 21% consent growth implies (2 October 2026), citing BusinessNZ’s September 2026 Planning Forecast
- interest.co.nz — median dwelling value down for six months (Cotality Home Value Index, September 2026)
- interest.co.nz — residential consents up 21% in the August year (50,653 in the year to August 2022)
- RBNZ — OCR increased to 2.75% on 2 September 2026
- RBNZ — Monetary Policy Review, 28 October 2026
- HUD — Going for Housing Growth, Incentives for Growth Fund
- Beehive — granny flat exemption up to 70 square metres
This article is general information only. It is not financial, investment, tax, or legal advice. Property investment carries risk, and current market data does not guarantee future results. Do your own due diligence and speak to a licensed adviser before you commit to a purchase.
Frequently Asked Questions
Is residential construction recovering in New Zealand in 2026?+
Yes, from a low base. Stats NZ reported residential building work in GDP up 4.4% in the June 2026 quarter, and the construction industry up 2.7% — the largest upward contributor to that quarter’s 0.2% GDP rise. BNZ calls it the best quarterly residential result since 2021, after volumes had contracted by about a quarter over nearly five years. It is a turn, not a boom.
How many new homes were consented in the year to August 2026?+
41,268, up 21% on the year to August 2025, according to Stats NZ. That is still well below the 50,653 homes consented in the year to August 2022. Stand-alone houses were 19,096 (up 21%), townhouses, flats and units 18,085 (up 25%), and apartments 2,381 (down 4.0%).
Does a building rebound mean house prices are about to rise?+
Not on the evidence so far. Cotality’s September 2026 Home Value Index, reported by interest.co.nz, put the national median at $797,078 — the sixth monthly fall in a row, and 1.33% lower than a year earlier. Auckland consents were up 19% while Auckland’s median value was down 3.2%.
Which regions are leading new-home consents?+
In the year to August 2026, Stats NZ recorded 17,264 new homes consented in Auckland (up 19%), 8,933 in Canterbury (up 35%), and 2,987 in Otago (up 21%). Auckland and Canterbury accounted for more than 70% of the national increase. The West Coast was the only region where the annual count fell.
What is the difference between the 4.4% and 4.8% residential growth figures?+
They are different Stats NZ measures of the same June quarter. The 4.4% is residential building in the GDP release (gross fixed capital formation). The 4.8% is seasonally adjusted residential building volume in Value of building work put in place. Both rose. Building-work figures stay provisional for the latest three quarters: the March residential fall was first published at 2.2% and now shows 0.1%.
Should an investor buy a new townhouse or an existing home to renovate?+
Run both, then prefer the one whose numbers still work. Townhouses, flats and units are 18,085 of the 41,268 consents — about 44% — so new compact stock is a growing part of the competition, especially in Auckland, where BNZ puts the townhouse share at 53%. With house values flat-to-down and residential construction prices up 1.4% in the June quarter, paying a new-build premium is harder to justify than buying existing stock below replacement cost and renovating. That is a screen, not advice.
See it in action
Browse AI-scored NZ investment properties with full financial breakdowns.
Browse propertiesMore ways to get started
Plans, local team contact, and background on who builds FindMyProperty.
More Articles
NZ Property Market Outlook September 2026: Why Long-Term Investors Are Still Buying
Listings hit a 12-year August high and Cotality’s median is under $800k, about 18% below the 2022 peak. Here’s why long-term NZ investors are still running the numbers.
Read →📉NZ Housing Market in August 2026: Value-Add Renovation Play
July sales fell 6.4% and values sit 17.7% below peak. FindMyProperty’s scored sub-$750k book: 76 listings still model 15%+ flip ROI.
Read →